
Heart Rate Variability and Stress: What HRV Really Shows
Which of two people is more stressed, the one whose watch reports an HRV of 31 milliseconds or the one whose watch reports 78? The answer may seem obvious, but the physiology doesn't support a simple comparison. The higher number isn't automatically the calmer person, and the lower number isn't a stress diagnosis. A 31 can be a strong day for someone whose personal range sits between 25 and 35, while a 78 can be a warning sign for someone who usually runs near 110.
That gap between what a device prints and what it means is where heart rate variability and stress get tangled up. The useful question is never "is my HRV good?" It's "what changed against my own normal, and what else changed alongside it?" This guide builds that idea in order, from what the signal is, to the metrics on your screen, to the conditions that distort a reading, to the evidence, to a routine you can run at home.
What Heart Rate Variability Says About Stress
Heart rate variability is the natural variation in the time between consecutive heartbeats, not the count of beats per minute. A resting rate of 60 tells you the average pace of your heart. HRV tells you how much the spacing between those beats stretches and shrinks around that average. The field settled on that definition through the standards published by the Task Force of the European Society of Cardiology and the North American Society of Pacing and Electrophysiology, which set shared terminology, measurement methods and physiological interpretation for HRV (the Task Force standards for HRV measurement).
A Metronome Compared With a Drummer
Picture a metronome ticking at identical intervals. Now picture a drummer playing that same tempo with feel, leaning into one beat and easing off the next. The flex is the musicianship, not a flaw in the timing. Your heart behaves like the drummer. The autonomic nervous system adjusts cardiac timing continuously in response to demands, recovery, breathing, emotion and attention, so the spacing between beats never stays perfectly even.
Under threat or sustained load, that timing tightens. The body mobilizes resources for action, cardiac regulation becomes less flexible, and variability tends to fall. When the demand passes, flexibility usually returns. Read that way, HRV is a gauge of how readily your body shifts gears, not a measure of how calm you feel in any given moment.
The working definition: HRV reflects changing autonomic regulation. It is not a diagnosis and not a universal score of mental health.
The signal matters beyond fitness tracking. In 2024, the U.S. National Heart, Lung, and Blood Institute reported that 119 participants, 16% of more than 700 adults tested, experienced myocardial ischemia during a mental-stress challenge, and participants with the lowest heart-rate variability were about twice as likely to experience ischemia as those with higher HRV.
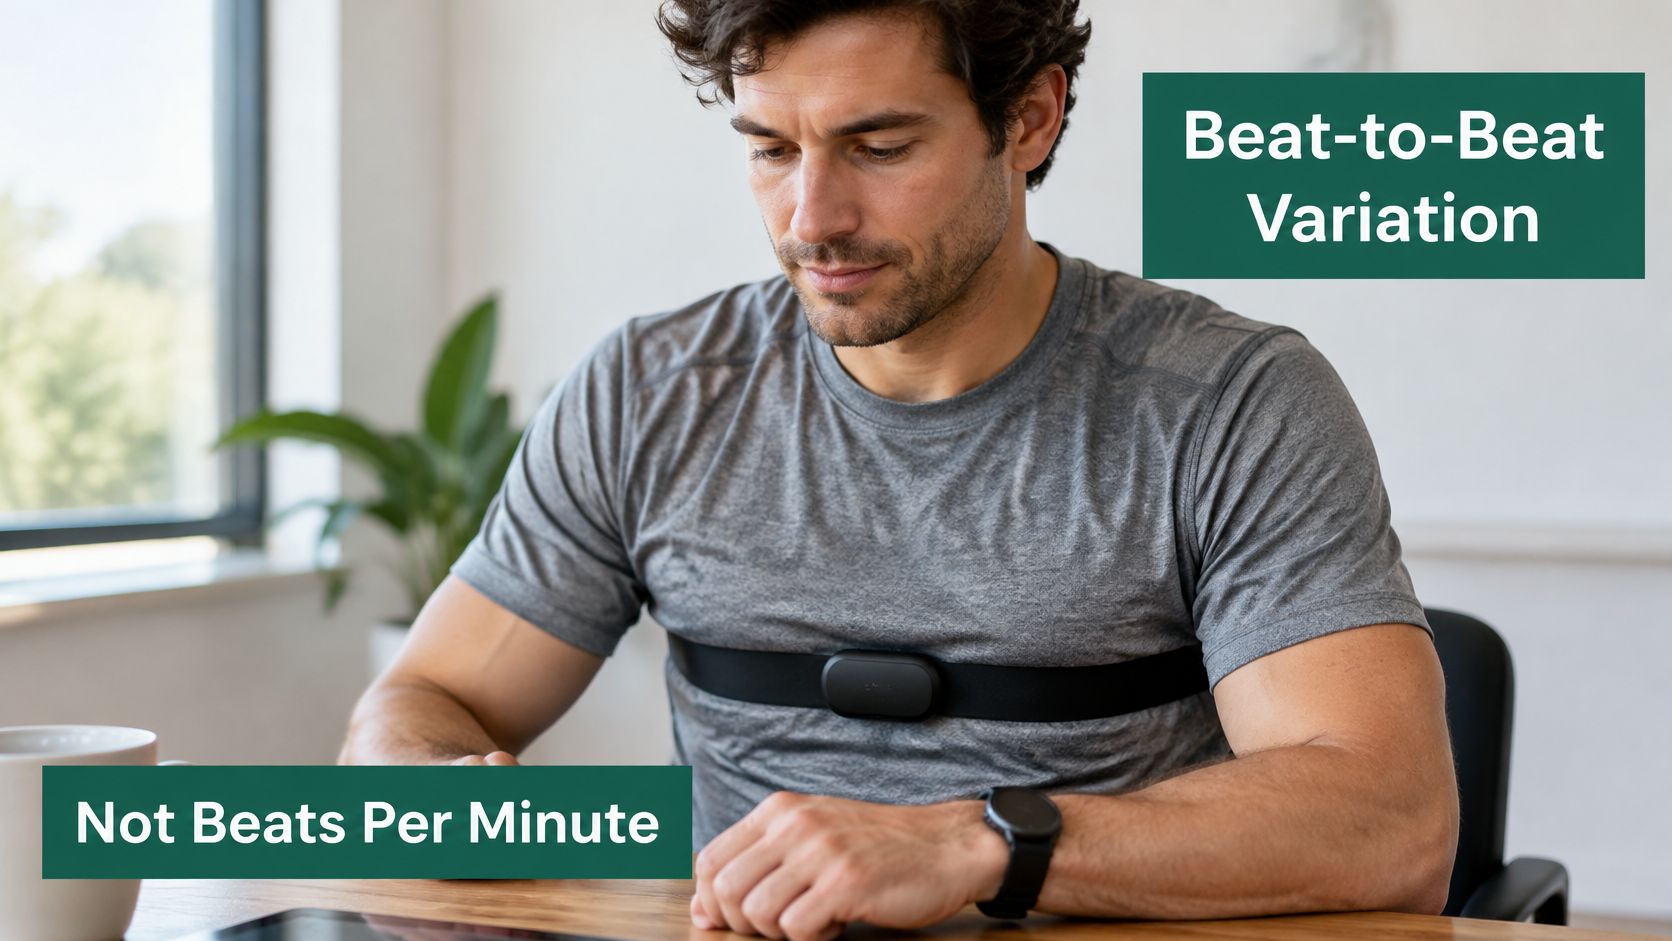
Here's where readers get stuck. A low reading feels like a verdict, but it's closer to a weather report. It can show that your system has spent more time mobilized than recovered across a stretch of days. It cannot tell you why, because a short night, a hard workout, a fever and a difficult conversation all push the same number down. If you want the wider picture of how the nervous system governs that response, a plain-language overview of nervous system regulation fills in the background.
The HRV Metrics You Will See on Your Device
A device report can show several statistics calculated from the same heartbeat sequence. Each describes a different feature of the changing gaps between beats, so the numbers are related but not interchangeable.
Metric | What it captures | Typical use |
|---|---|---|
SDNN | Overall variation across the whole recording | Broader variation; commonly reported in stress research |
RMSSD | Beat-to-beat differences between adjacent intervals | Parasympathetic-linked variation; commonly reported in stress research |
pNN50 | Percent of adjacent intervals differing by more than 50 ms | Another time-domain measure of beat-to-beat variation |
HF power | Variation within the breathing-linked frequency band | Can change with breathing and stress |
LF/HF ratio | Ratio of low- to high-frequency power | Interpreted cautiously; findings vary across stress studies |
Heart rate is an average; HRV describes variation around it. A device might show a resting heart rate of 58 beats per minute and an HRV reading of 42 at the same time. The first number counts beats per minute. The second summarizes differences between beat intervals.
SDNN summarizes variation across the recording, while RMSSD emphasizes differences between successive intervals. They are the most commonly reported time-domain measures in stress research, but they describe different statistical features. pNN50 reports the proportion of adjacent intervals that differ by more than 50 milliseconds. It often changes in a direction similar to RMSSD, but the measures are not identical.
Which Number to Watch First
If your device reports RMSSD, use it as one possible trend marker. It reflects short-term beat-to-beat variation and is commonly used in short recordings. A single reading still cannot establish whether stress caused a change.
HF power captures variation in a frequency band linked to breathing. That makes it sensitive to changes in breathing rate and depth, as well as other influences. The LF/HF ratio is sometimes presented as a balance between two systems, but its meaning is debated and study findings vary. Avoid treating it as a standalone stress score.
Your posture and breathing can shift a reading, too. Before comparing values, keep the device, metric and recording conditions consistent. Then look for a pattern against your own baseline rather than comparing your number with someone else's. A clearer grasp of how the nervous system works can help put these measurements in context.
How to Record HRV Accurately
A resting HRV reading is useful only when you can compare it with other readings taken under similar conditions. Research protocols often use short, controlled recordings, and the Journal of the American Heart Association review describes recording duration in relation to the HRV measure being assessed. At home, consistency matters more than matching a research protocol exactly.
Method | Recording length | Conditions | Best use |
|---|---|---|---|
Standardized resting ECG | Short, controlled recording | Quiet, with a consistent posture and breathing pattern | Research and clinical baselines |
Supine protocol | Short, controlled recording | Still, quiet, lying down | Controlled clinical assessment |
Short RMSSD window | A short recording, depending on the device | Rested and still | Tracking RMSSD under repeatable conditions |
Wearable spot check | A few minutes, as set by the device | Movement and posture may vary | Tracking trends, not comparing with lab readings |
Overnight wearable reading | Most of the night, averaged in blocks | Sleep, with relatively little movement | Following morning trends over several days |
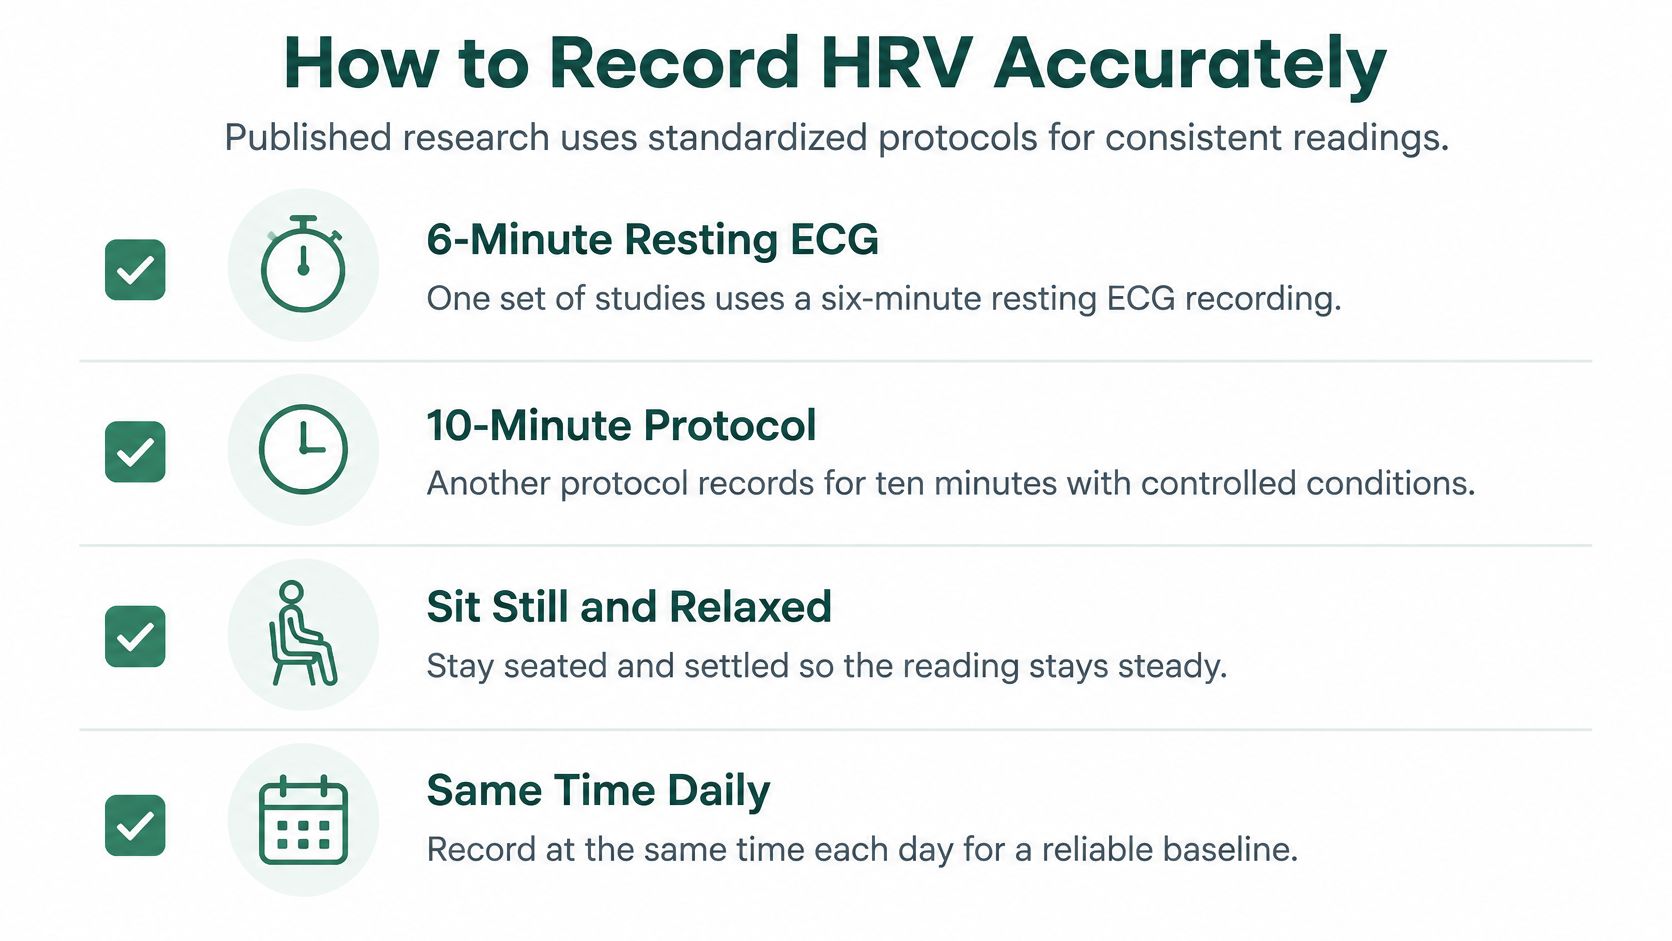
Five everyday conditions can shift a reading before stress is even considered: time of day, posture, recent movement, breathing, and the device or metric used. A reading during a walk, conversation, or soon after standing is a different snapshot from one taken while at rest. The graphic summarizes the conditions that help make readings more comparable.
The Home Recording Checklist
Use the same time of day: A morning reading, before coffee or training, gives you a consistent comparison point.
Keep the same position: Choose a supported seated or lying position, then use it each time.
Pause before recording: Sit for a few minutes so your heart rate can settle.
Use the same device and metric: Changing either can make a new reading difficult to compare with earlier ones.
Note your breathing: Record whether you were breathing slowly or normally, since breathing can shift the reading.
A steady routine makes patterns easier to interpret. One carefully repeated reading is more useful for tracking your baseline than several taken under changing conditions.
What Studies Show About HRV Under Stress
Pooled data settles the basic question of whether stress shows up in the signal. A meta-analysis published in Age and Ageing in 2025 found significant HRV differences between stress and recovery periods for RMSSD (standardized mean difference -0.63, P=.005), SDNN (-1.05, P=.001), LF (0.54, P=.01), and LF/HF (0.69, P=.006). The negative values on the time-domain measures mean variability was lower during stress than during recovery. The positive values on the frequency measures mean those moved in the opposite direction, which is exactly why a single ratio shouldn't be read as your stress level.
The pattern isn't confined to laboratory stress tests. A 2023 systematic review of healthcare providers screened 413 records and included 17 studies that measured HRV during real or simulated resuscitations, procedures or emergencies. Eleven of those 17 studies, about 65%, reported statistically significant HRV responses that followed a predictable pattern. Three involved medical simulations, six involved clinical procedures, and eight took place during real medical emergencies, so most of the evidence came from demanding work rather than a contrived task in a lab.
Intervention studies add the other half of the picture. In people with cardiovascular disease, programs intended to reduce stress increased short-term SDNN by an average of 6.43 ms and 24-hour SDNN by 10.92 ms, with short-term low-frequency power also rising (meta-analysis of stress-reduction interventions and HRV). Reduced load showed up in the signal.
A group-level pattern tells you what tends to happen across many people. It doesn't tell you what happened to you on Tuesday.
What the Evidence Does Not Support
Nothing here turns one reading into a diagnosis. A low morning number cannot identify the cause or severity of anxiety, depression, trauma or burnout, and a predictable group average doesn't mean every individual moves in the same direction or by the same amount. Findings vary by context, measurement approach and study design. The evidence supports using HRV as one physiological lens on load and recovery, alongside clinical assessment and the person's own account of how they feel.
It's also worth watching what else you use to push through a heavy week. Caffeine masks load rather than reducing it, and if matcha is your routine, compare L-theanine doses in matcha so you know how much of the calming amino acid sits alongside the caffeine in your cup.
Expect from your own data what the research shows: a tendency, not a guarantee. If your readings drop across several stressful days and climb back during quieter ones, your device is doing its job. If they wander with no clear relationship to your week, you may be looking at sleep, hydration or training load instead, and it's worth reading the difference between stress and burnout before drawing conclusions about either.
Reading HRV Trends Without Overreacting
The fastest way to misread your heart is to treat one morning's number as a verdict on your mental state. Every confounder below moves the reading on its own, without any change in how stressed you are.
Factor | How it shifts the reading | How to standardize |
|---|---|---|
Breathing rate | Slow paced breathing raises HRV through respiratory sinus arrhythmia | Record the breathing pattern or use a set rate |
Posture | Changing position alters heart timing | Measure in the same position each time |
Physical activity | Recent exercise changes variability for hours | Measure at rest, at the same time of day |
Sleep and circadian timing | Poor or shifted sleep lowers variability | Compare readings after similar sleep |
Illness | Infection or fatigue can lower variability | Note symptoms alongside the reading |
Medication and alcohol | Some medications and alcohol change autonomic balance | Record intake and compare on similar days |
Age and fitness | Baseline values differ between people | Compare against your own baseline, not others |
None of these are minor technicalities. Respiration, posture, physical activity, sleep, circadian timing, illness, medication, age and recording duration all influence the measure, which is why a single low value shouldn't be labeled "stress" (review of HRV as a stress correlate). The authors of that review recommend standardizing posture and breathing, collecting repeated baseline measurements, and interpreting change against the person's own trend rather than a population threshold.
That last point solves most of the confusion. A population cutoff answers a question about groups. You need an answer about one person, measured on the same device, at the same hour, in the same chair.
Why Your Own Baseline Is the Only Fair Comparison
Metric choice can change the conclusion by itself. In 2025, research indexed by PubMed tested a new normalized HRV measure in 51 participants across relaxation and experimentally induced stress conditions, and the normalized measure changed significantly in both states while conventional log-transformed RMSSD and SDNN did not (PubMed study of a normalized HRV measure). Same participants, same sessions, different statistic, different answer.
Practical rule: Compare today's reading with your own last two weeks, never with someone else's number.
What do you do with a trend once you have one? Use it to guide recovery behavior and to structure conversations with a clinician or therapist, and read it beside sleep, mood, symptoms and daily functioning rather than in isolation. If the trend is drifting and you want tools for shifting it, how to regulate your nervous system covers the daily practices that tend to move the needle.
Practice Breathing and Build Your HRV Baseline
Slow breathing is the most direct lever you have, because it changes the reading through a known pathway rather than through guesswork. Work through the sequence below in order, ideally at the same time each day.
Sit upright with your back supported and your feet flat on the floor. A settled posture keeps the reading steady, so any change you see afterward comes from breathing rather than from a shift in position.
Set a timer for 5 to 10 minutes. A defined window gives you a repeatable session instead of an open-ended one, and repetition is what makes the practice visible in your data.
Breathe slowly at about six breaths per minute, with a five-second inhale and a five-second exhale. Slow breathing strengthens the breathing-linked component of heart timing through respiratory sinus arrhythmia, which is why paced breathing shows up in the numbers so quickly.
Keep the breath low in the belly and your shoulders relaxed. An unhurried exhale does more for the rhythm than a large inhale, and shrugging the shoulders adds muscular tension that works against the pattern.
If you use a biofeedback device, watch the rhythm trace and aim for a smooth, wave-like pattern. Chasing a perfect curve defeats the purpose, so let the breath settle rather than forcing it.
Record the reading before and after the session and note the breathing rate. Without the pace written down, a rise afterward can't be attributed to anything in particular.

If paced breathing feels mechanical, somatic breathwork exercises offer variations that pair the breath with movement and body awareness.
Habits That Move the Trend Over Weeks
Breathing changes a reading within minutes. Sleep, movement and alcohol change the baseline underneath it. Consistent sleep and wake times matter more than total hours. Regular aerobic activity at a comfortable intensity supports the trend, while heavy training without recovery days pushes it down.
Alcohol is the variable people most often forget to log. A couple of drinks in the evening can leave the next morning's reading lower than a stressful workday would. Log it for two weeks before you blame your calendar.
A note on timing: A single session is a test of the technique. Fourteen days is a test of the habit.
Build a 14-Day Baseline
Pick one fixed time each morning, before coffee or exercise, and keep it.
Record two to five minutes of resting data using the recording checklist from earlier in this guide.
Note sleep, alcohol, training, illness and breathing practice beside every reading, so patterns become visible rather than remembered.
After 14 days, calculate a personal range from your own readings, not from a population figure.
If your baseline drops and stays low alongside symptoms that affect daily life, speak with a clinician rather than relying on the number alone.
Changes build across weeks of practice, not in one session, which is why the trend matters more than any single morning. At Be Your Best Self & Thrive Counseling, PLLC in St. Petersburg and Sarasota, sessions often include techniques such as breathing exercises, yoga and mindfulness. Through this guidance, clients learn to regulate their nervous system, become experts in their own needs, wants, desires and goals, and build healthier relationships with the people and the world around them. Bring your readings and your symptoms to the conversation, and let both inform the plan.
Heart rate variability gives you a window into how your body is carrying stress, and the team at Be Your Best Self & Thrive Counseling, PLLC can help you read that window accurately. Our St. Petersburg and Sarasota therapists combine traditional talk therapy with nervous-system informed, mind-body-spirit care, including breathwork, mindfulness and somatic awareness, so the trends on your device connect to how you live. If your readings have been low for weeks and your sleep, mood or daily functioning is shifting with them, reach out for a free initial consultation and let's make sense of the pattern together.